Many directions, one reconstruction
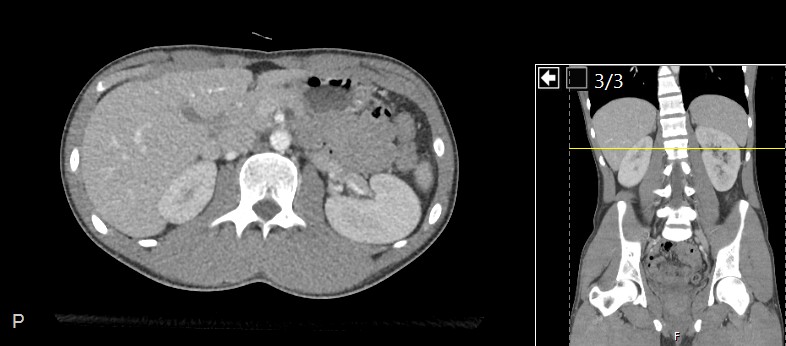
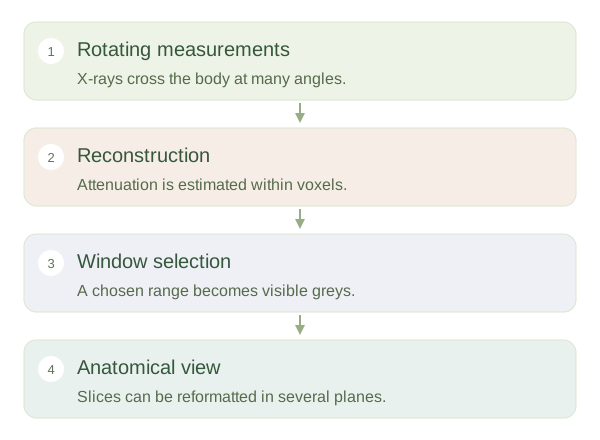
Computed tomography uses x-rays measured from many angles around the patient. A computer combines these measurements to estimate attenuation within small volume elements called voxels. The resulting dataset can be displayed as axial slices or reformatted into coronal, sagittal and other views. This reduces the overlap that limits a plain radiograph. CT is not simply a photograph taken inside the body: each displayed value is a reconstruction based on measurements and mathematical processing, so motion and other factors can introduce errors.
From measurements to a CT slice
 Open diagram larger ↗
The scale behind the grey
CT attenuation is commonly expressed in Hounsfield units. By convention, water is near zero and air near minus one thousand. Fat has negative values, many soft tissues have modest positive values and dense bone has high positive values. These are useful patterns rather than exact diagnostic labels for every pixel. A display selects a range to map onto visible greys. A lung window reveals detail across air-filled lungs, while a soft-tissue window separates structures with smaller attenuation differences. Bone windows emphasise mineralised tissue and its edges.
Interpret appearance in context
The same dataset can therefore look quite different when the changes. An area that seems uniformly white in one setting may contain visible internal detail in another. Contrast material can alter vessel or organ attenuation, and the timing after injection changes the pattern. Slice thickness also affects visibility because a can average several materials, known as partial-volume averaging. CT is useful for detailed spatial anatomy, but it uses ionising radiation and must answer an appropriate clinical question. Understanding acquisition, window and contrast phase is essential before comparing the brightness of two structures.